December 4, 2023
Nexusguard continually amasses a vast amount of data, revealing various aspects of attack traffic with steadfast openness. This intelligence forms the backbone of our insightful reporting, assisting in the creation of regular reports, which encapsulate bandwidth usage, mitigation strategies, and event summaries. These summaries include crucial attack statistics such as the top application DDoS attacks, top volumetric DDoS attacks, and beyond.
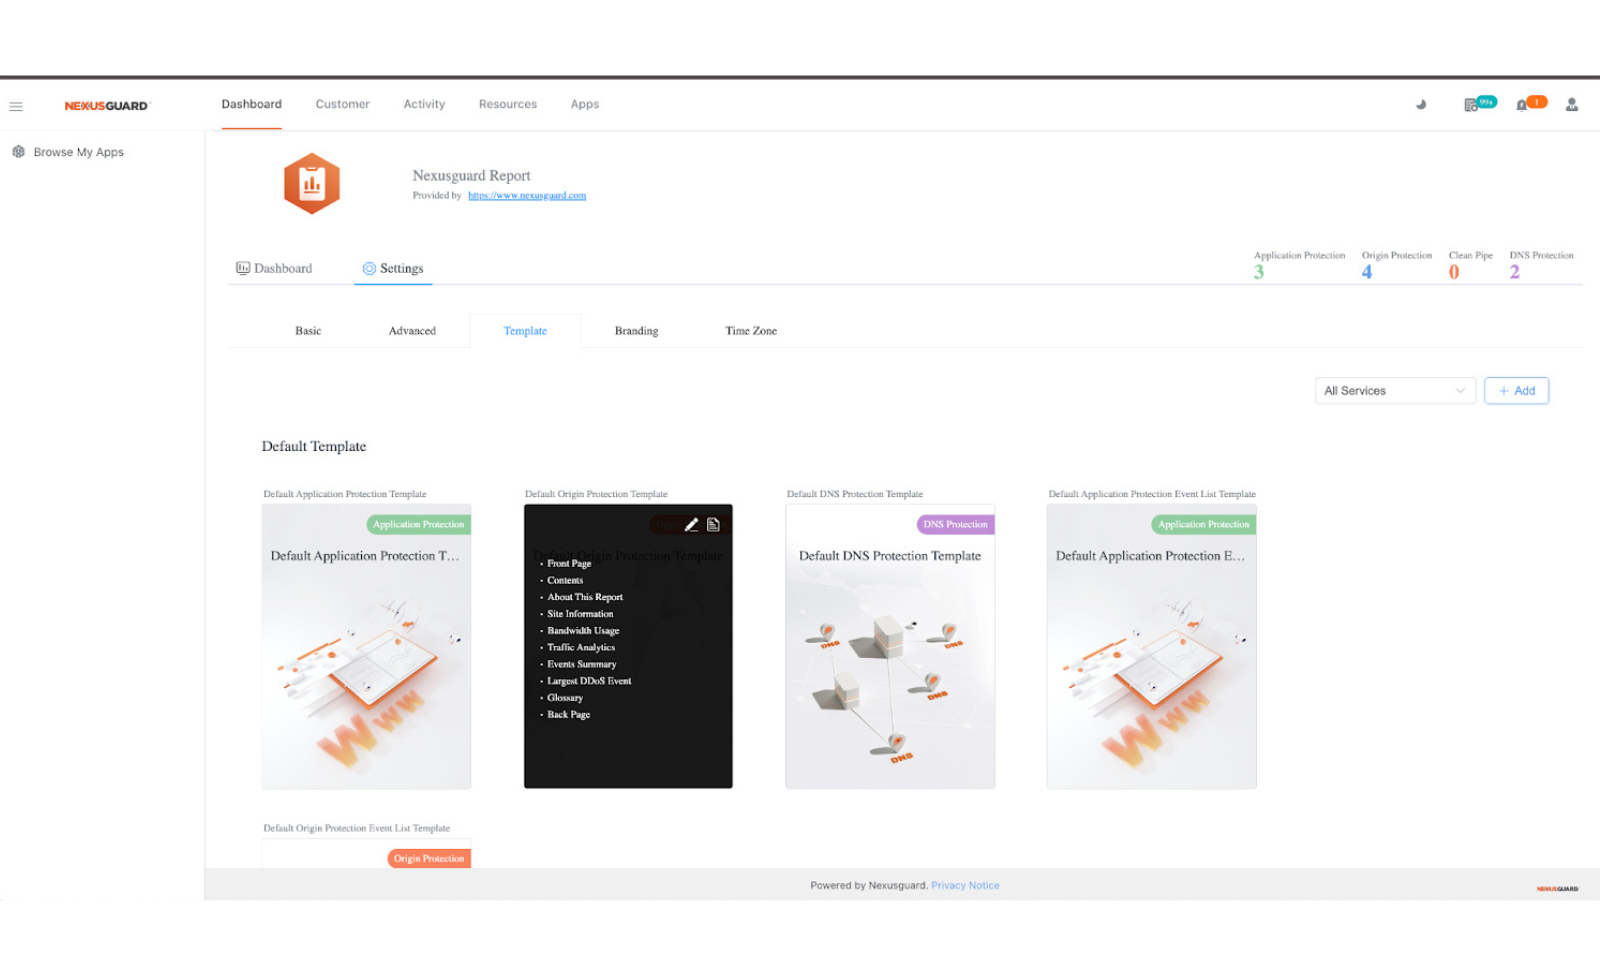
Now, we're excited to announce that the Nexusguard Report App, especially for our Application Protection service, has undergone significant enhancements. As a pivotal component of the Nexusguard Portal, the Report App serves as a comprehensive repository for Nexusguard service reports. With our latest enhancements, users are now empowered to generate predefined or user-customizable reports more efficiently and effectively. Let's take a closer look at the key enhancements, which include Mitigation Efforts, Bandwidth Usage and Event Summaries for Volumetric, Application DDoS, and WAF Threat events.

Mitigation details are now presented in two parts: AppShield Mitigation and Netshield Mitigation, with traffic graphs broken down by site, giving you a more granular view of your network security.
With Netshield Mitigation, you can see the L3/L4 volumetric based DDoS attacks that have been stopped by our powerful Netshield engine. You'll also be able to view the clean traffic that has been passed on to our AppShield engine for further inspection and scrubbing.
Meanwhile, AppShield Mitigation provides you with in-depth reporting on L7 application/HTTP-based DDoS attacks that have been dropped by our advanced AppShield engine. You'll also have access to information on the clean traffic that has been passed on to our WAF engine for further scrutiny and scrubbing.
These new features give you even greater visibility and control over your network security.


Our bandwidth utilization overview is an essential tool for monitoring the traffic of your protected resources. And now, we've made it even better with two detailed traffic graphs.
The Raw Bandwidth graph shows the total inbound traffic before scrubbing, while the Clean Bandwidth graph showcases the scrubbed traffic that is delivered to your protected resources.
Moreover, each reporting month now includes detailed information on your network traffic, including the peak clean traffic observed on a particular day of the month and the 95th percentile Mbps level of the month. With this detailed information at your fingertips, you'll have a better understanding of your network traffic and be able to make more informed decisions.

In the past, our event summaries provided a general overview of DDoS and WAF events. But now, we've taken things to the next level. We present not only the total number of DDoS and WAF events for the month, but also the percentage breakdown of these events.
To help you better understand these events, we've also included a distribution chart that breaks down the data even further. The chart provides a visual representation of the aggregate duration of all attack events for the month, as well as the average duration of each attack. You'll also be able to see the longest and shortest single attack durations, the quantity of attack vectors, and statistics on attack frequency.


Our latest update includes an updated Volumetric Event Summary that gives you a detailed overview of volumetric DDoS attacks.
Not only will you see the total number of volumetric DDoS events for the month, but we've also added figures for the largest and smallest volumetric attacks, as well as the average attack size. We've also included attack size distribution graphs in both bps and pps, so you can better understand the characteristics of these attacks.
To give you a better idea of the duration of these attacks, we've included information on the longest and shortest volumetric attack durations. You'll also see the average volumetric attack duration and the aggregated duration of all volumetric attacks for the month.
But that's not all - we've also added a new metric that reveals the quantity of attack vectors in a single volumetric DDoS event. This provides an indication of the complexity of attacks launched against your protected resources, including attack patterns and packet sizes.
With richer data sets, you'll have a better understanding of the types of threats your network is facing and be able to take the necessary actions to protect against them.


Focusing specifically on L7 attacks, our updated Application DDoS Events Summary provides a more comprehensive overview of your network's application DDoS events. You'll see figures for the largest and smallest application attacks, as well as the average application attack size. We've also included an attack size distribution chart, so you can easily visualize the nature of these attacks.
With our extensive monitoring and threat detection capabilities, you'll be better equipped than ever to protect your websites and applications from all types of cyber threats, no matter where they come from.


WAF Threat Events Summary
Our enriched WAF Threat Events Summary provides an in-depth look at the threats your WAF is facing, including the aggregated threat attempts for the month and the average number of threat attempts in a single WAF event. We've also included information on the WAF event with the most threats, as well as the WAF event with the least threats, to help you identify patterns and trends.
But that's just the beginning. We've also included a WAF Threat Type Distribution Chart based on the OWASP Top 10 threats, which provides a clear visual depiction of the distribution of threats your WAF has blocked. This can help you understand the types of attacks your WAF is protecting against and prepare your network to defend against similar attacks in the future.
In addition, we've added distribution charts showing the top 10 attack sources by country and the top 10 Bad Bot IP addresses. This information can help you pinpoint potential threats and take action to protect your assets from a wide range of attacks.

At Nexusguard, we believe in providing our customers with the best possible service. That's why we've developed a range of powerful Apps that extend the capabilities of our platform's standard features. Our Add-ons, including the Report App, Network Behaviour Threat Detection, Smart Filter, and Cloud Diversion, were created to meet customer feature requests and enhance our existing services. These Apps can be used as standalone features or as part of a package to give you even more control over your network security. We're always improving our Apps with regular upgrades and new releases, so you can stay ahead of the curve and future-proof your security infrastructure.
For more information, please read about Nexusguard’s Application Protection and Origin Protection services.

Nexusguard is committed to providing our customers with the best possible tools and insights to stay ahead of cyber threats. The latest update to the Nexusguard Report App includes numerous enhancements that give you even greater visibility and control over your network security.